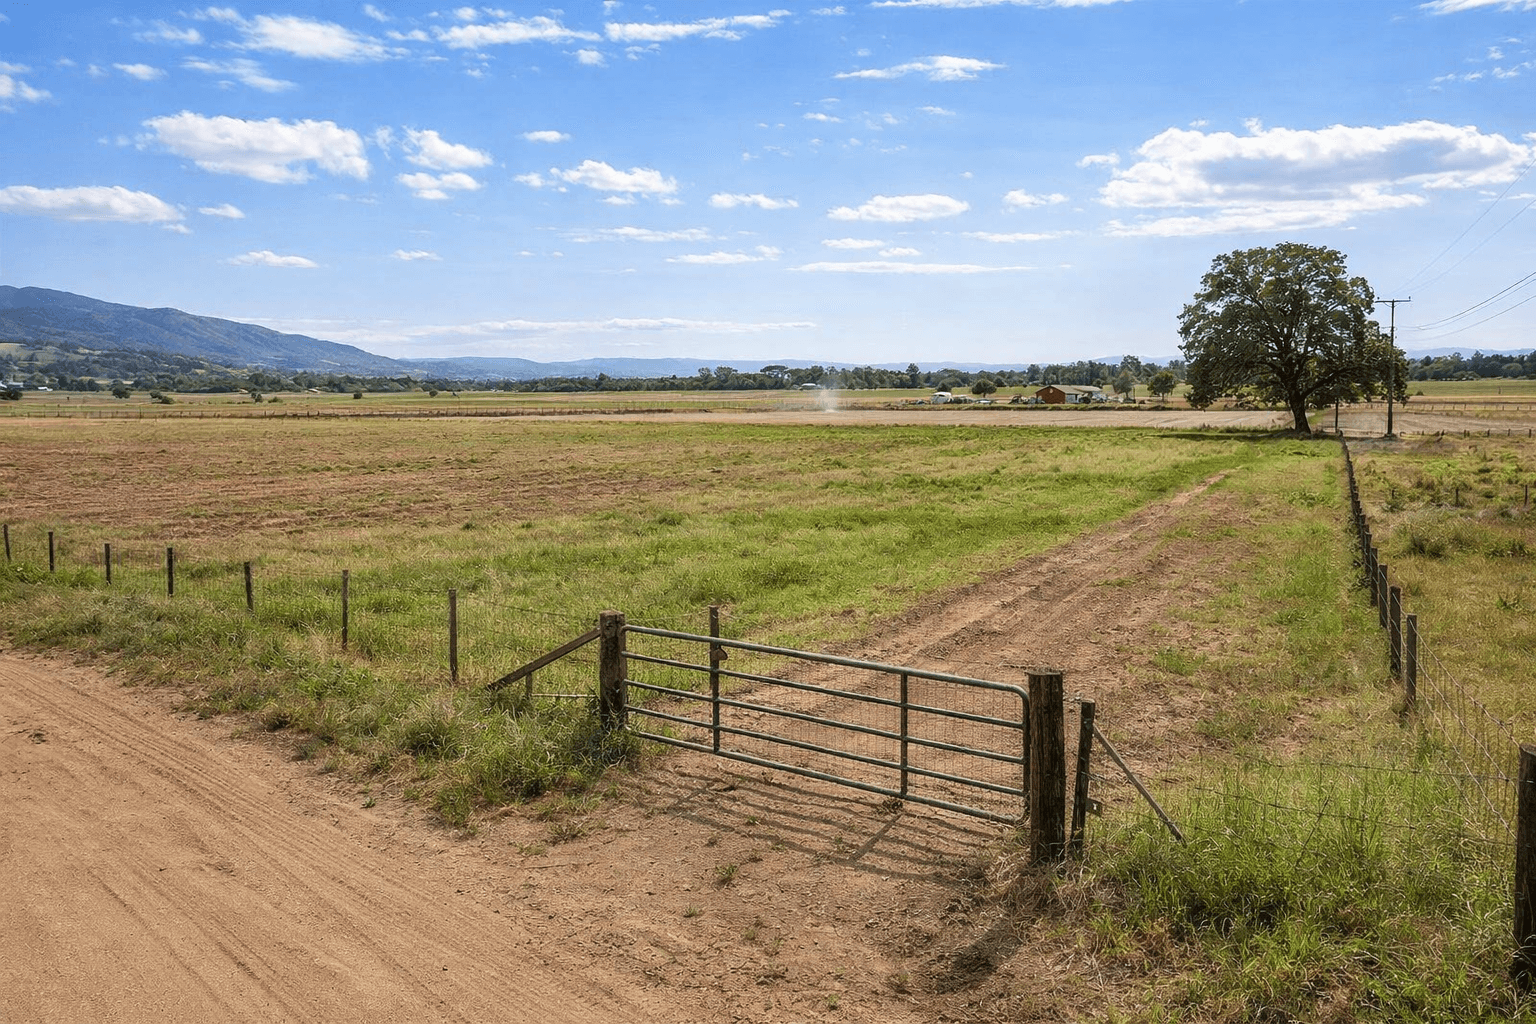
Rural homesite
Inputs: 2 acres, paved road, partial utilities, mostly usable terrain.
Range: $92,000 - $112,000
Confidence: Medium
Strategy: List near market pace and review activity after 21 days.
Estimate what your vacant land may be worth, compare price-per-acre assumptions, and get a practical listing strategy for lots, acreage, and raw land.
Start with a quick estimate. Switch to pro comp analysis when you have recent sold land sales ready.
Premium features
Constraints
Informational estimate only. This is not an appraisal, survey, engineering report, or legal advice.
The calculator follows an appraisal-style comparable-sales workflow where possible: start with sold land sales or a local price-per-acre anchor, normalize for acreage, then adjust for access, utilities, buildability, market condition, premium features, and known constraints.
When sold comps are not available, Quick Estimate stays conservative by blending a market-area acreage benchmark with any local anchors you add, such as assessed land value, a nearby sale, or a known price-per-acre reference. Confidence rises when the data is specific, recent, and local.
A basic price-per-acre calculator multiplies acres by one local rate. That can be useful as a sanity check, but vacant land value usually moves with access, utilities, buildability, terrain, zoning, market pace, and buyer use.
Listing Wand starts with acreage and local anchors, then adjusts the range around the facts a buyer or appraiser will question first. Use it when you want to know what your land may be worth, whether a listing price is defensible, or how sold land comps should affect your asking price.
Acres x local $/acre anchor
Access, utilities, buildability, and constraints
Lower, middle, or upper range based on timing
The strongest calculator result comes from local, property-specific inputs. State and county help frame the market, but the range improves when you add a known local price-per-acre anchor or recent sold comps.
Calculator output is only as strong as the numbers you bring into it. Start with public records and recent market evidence, then use the calculator to organize the assumptions into a range.
Use agricultural land values as a broad rural benchmark, not a final buildable-lot price.
Check assessed land value, parcel size, property class, tax history, and ownership records.
Confirm flood-map context before leaning on buildable-land pricing assumptions.
Use a qualified appraiser when the value needs to support lending, tax, estate, or legal decisions.
State averages help with broad orientation, but they do not price a specific parcel. USDA NASS publishes annual agricultural land value data by state and region. Those figures are useful for rural context, but a buildable residential lot, infill parcel, waterfront tract, or landlocked parcel can move far above or below the agricultural average.
| State / Area | 2025 farm real estate / acre | 2025 cropland / acre |
|---|---|---|
| United States | $4,350 | $5,830 |
| California | $13,700 | $17,940 |
| Florida | $8,700 | $10,550 |
| Iowa | $9,790 | $10,300 |
| North Carolina | $5,470 | $5,360 |
| Texas | $2,970 | $2,710 |
| Wyoming | $1,000 | $2,000 |
Source: USDA NASS 2025 Land Values Summary. Farm real estate includes land and buildings on farms, so use these figures as context, not as the final value for a residential, commercial, or subdividable parcel.
Sold comps improve your estimate because they show what similar buyers recently paid. Favor closed sales with similar acreage, access, utilities, topography, and likely use.
Thin rural markets often have few clean land comps. Quick Estimate can still produce a directional range from market-area profile, acreage band, access, utilities, terrain, market condition, and any local anchor you can provide.
If the estimate is based only on the regional benchmark, treat it as a starter range. Before launch, add sold comps or a local price-per-acre anchor and verify legal access, flood or wetlands risk, perc/septic feasibility, utility path, and restrictions.
Inputs: 2 acres, paved road, partial utilities, mostly usable terrain.
Range: $92,000 - $112,000
Confidence: Medium
Strategy: List near market pace and review activity after 21 days.
Inputs: 10 acres, gravel access, limited utilities, rolling terrain.
Range: $78,000 - $103,000
Confidence: Low to Medium
Strategy: Price with room for due diligence questions and show access clearly.
Inputs: City location, public utilities nearby, flat lot, warm demand.
Range: $185,000 - $225,000
Confidence: Medium to High
Strategy: List near the upper-middle if zoning and buildability are clean.
Pick a list price based on your goal. A faster sale usually means pricing closer to the lower-middle of the range. Market pace usually starts near the suggested list price. A premium strategy needs stronger proof, cleaner due diligence answers, and better listing presentation.
Set a review checkpoint before launch. If inquiry quality is weak after 14-21 days, revisit comps, presentation, and price.
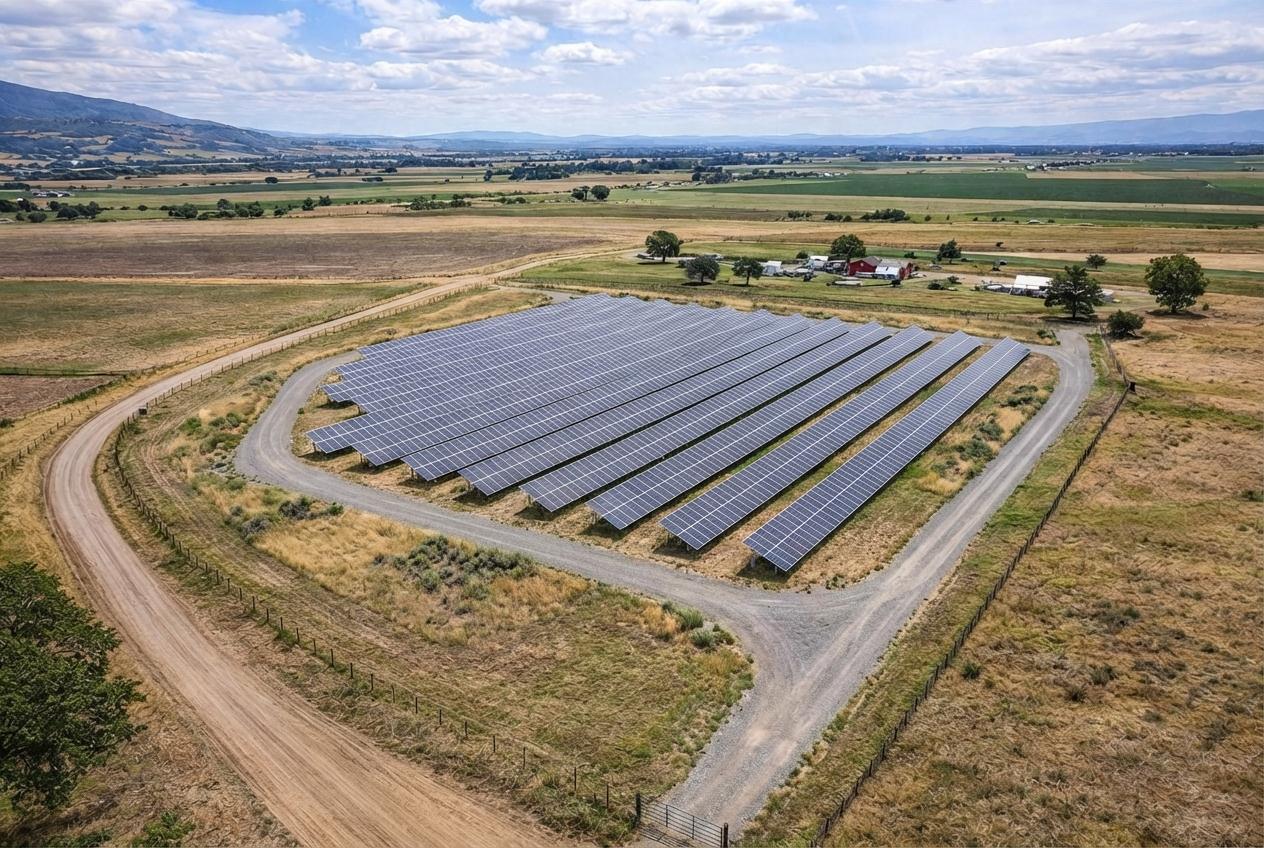
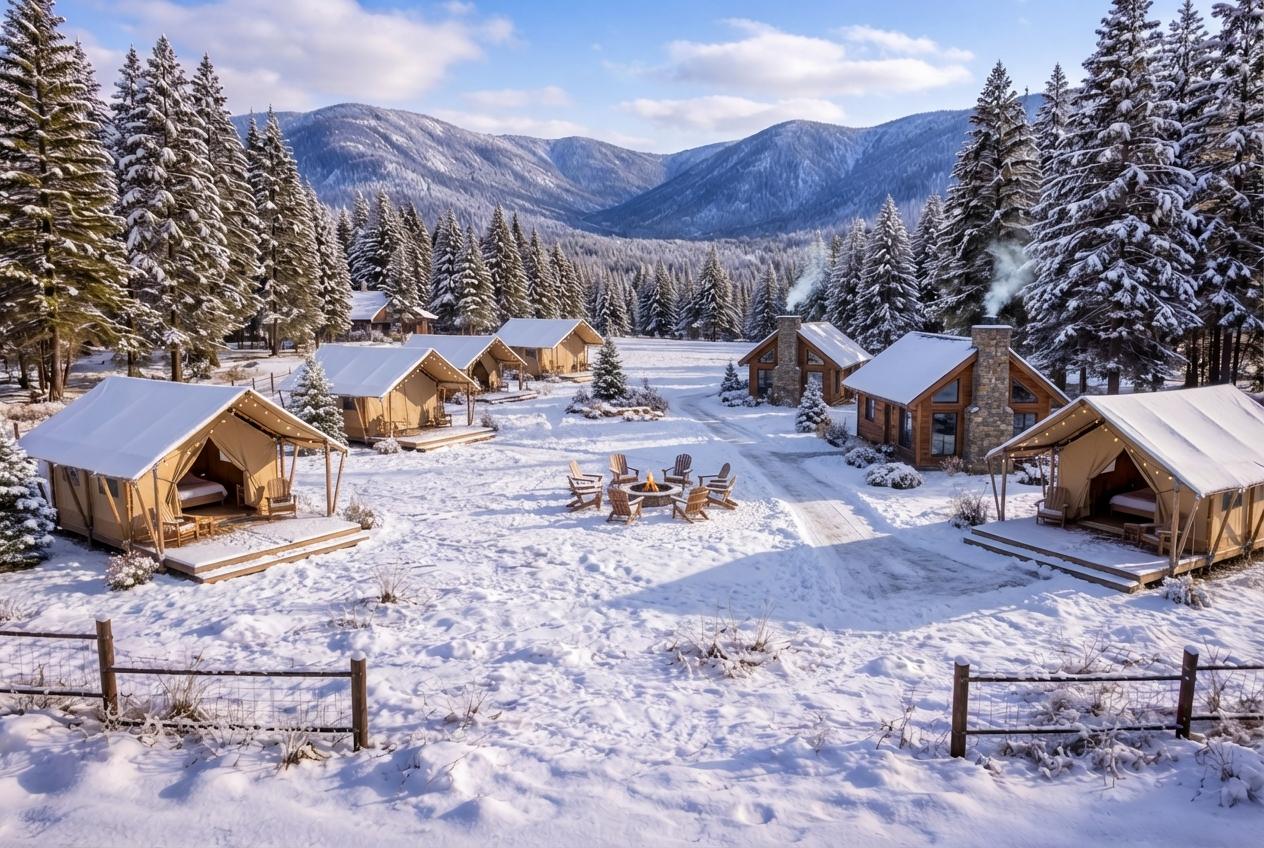
Once the price range is set, show buyers what the land could become. Listing Wand can create realistic concept visuals for homes, cabins, retreats, subdivisions, seasonal views, and more.
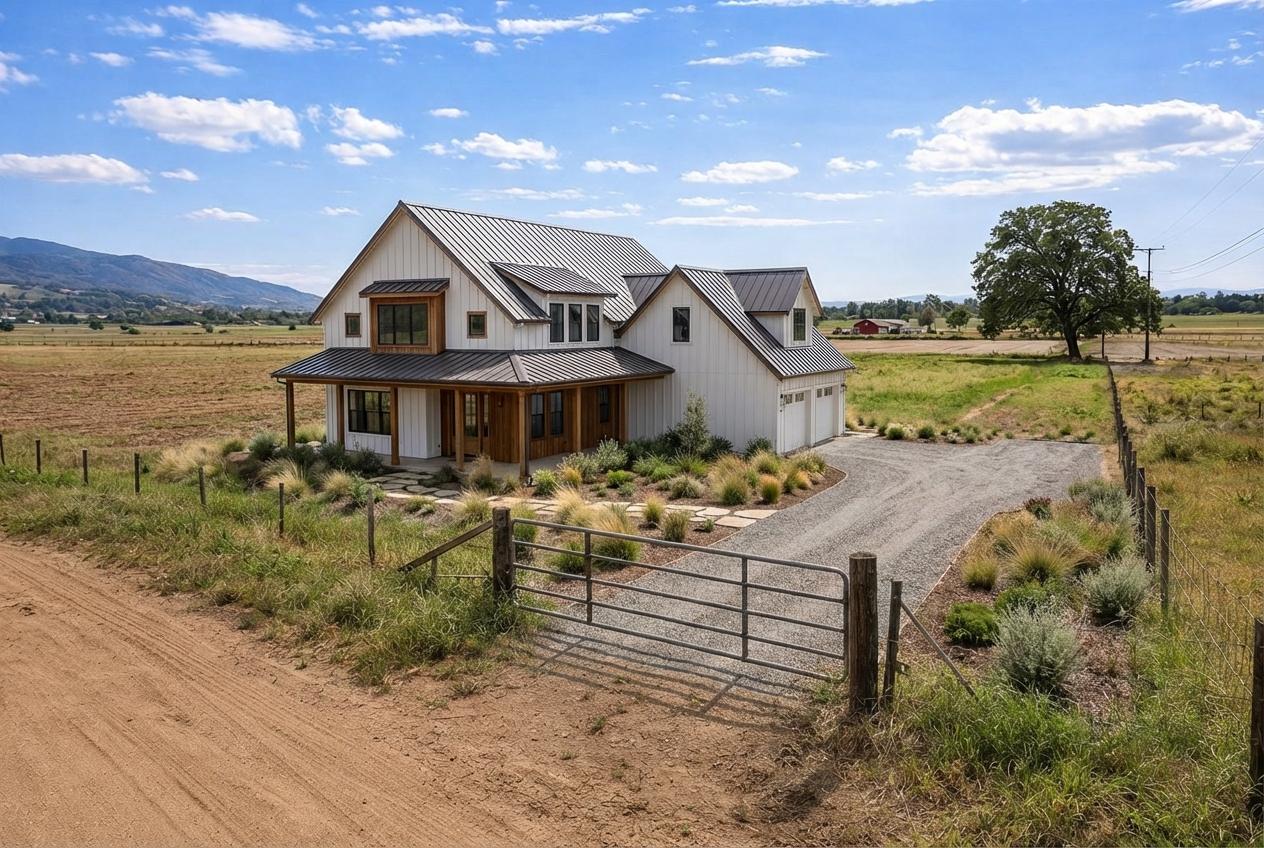
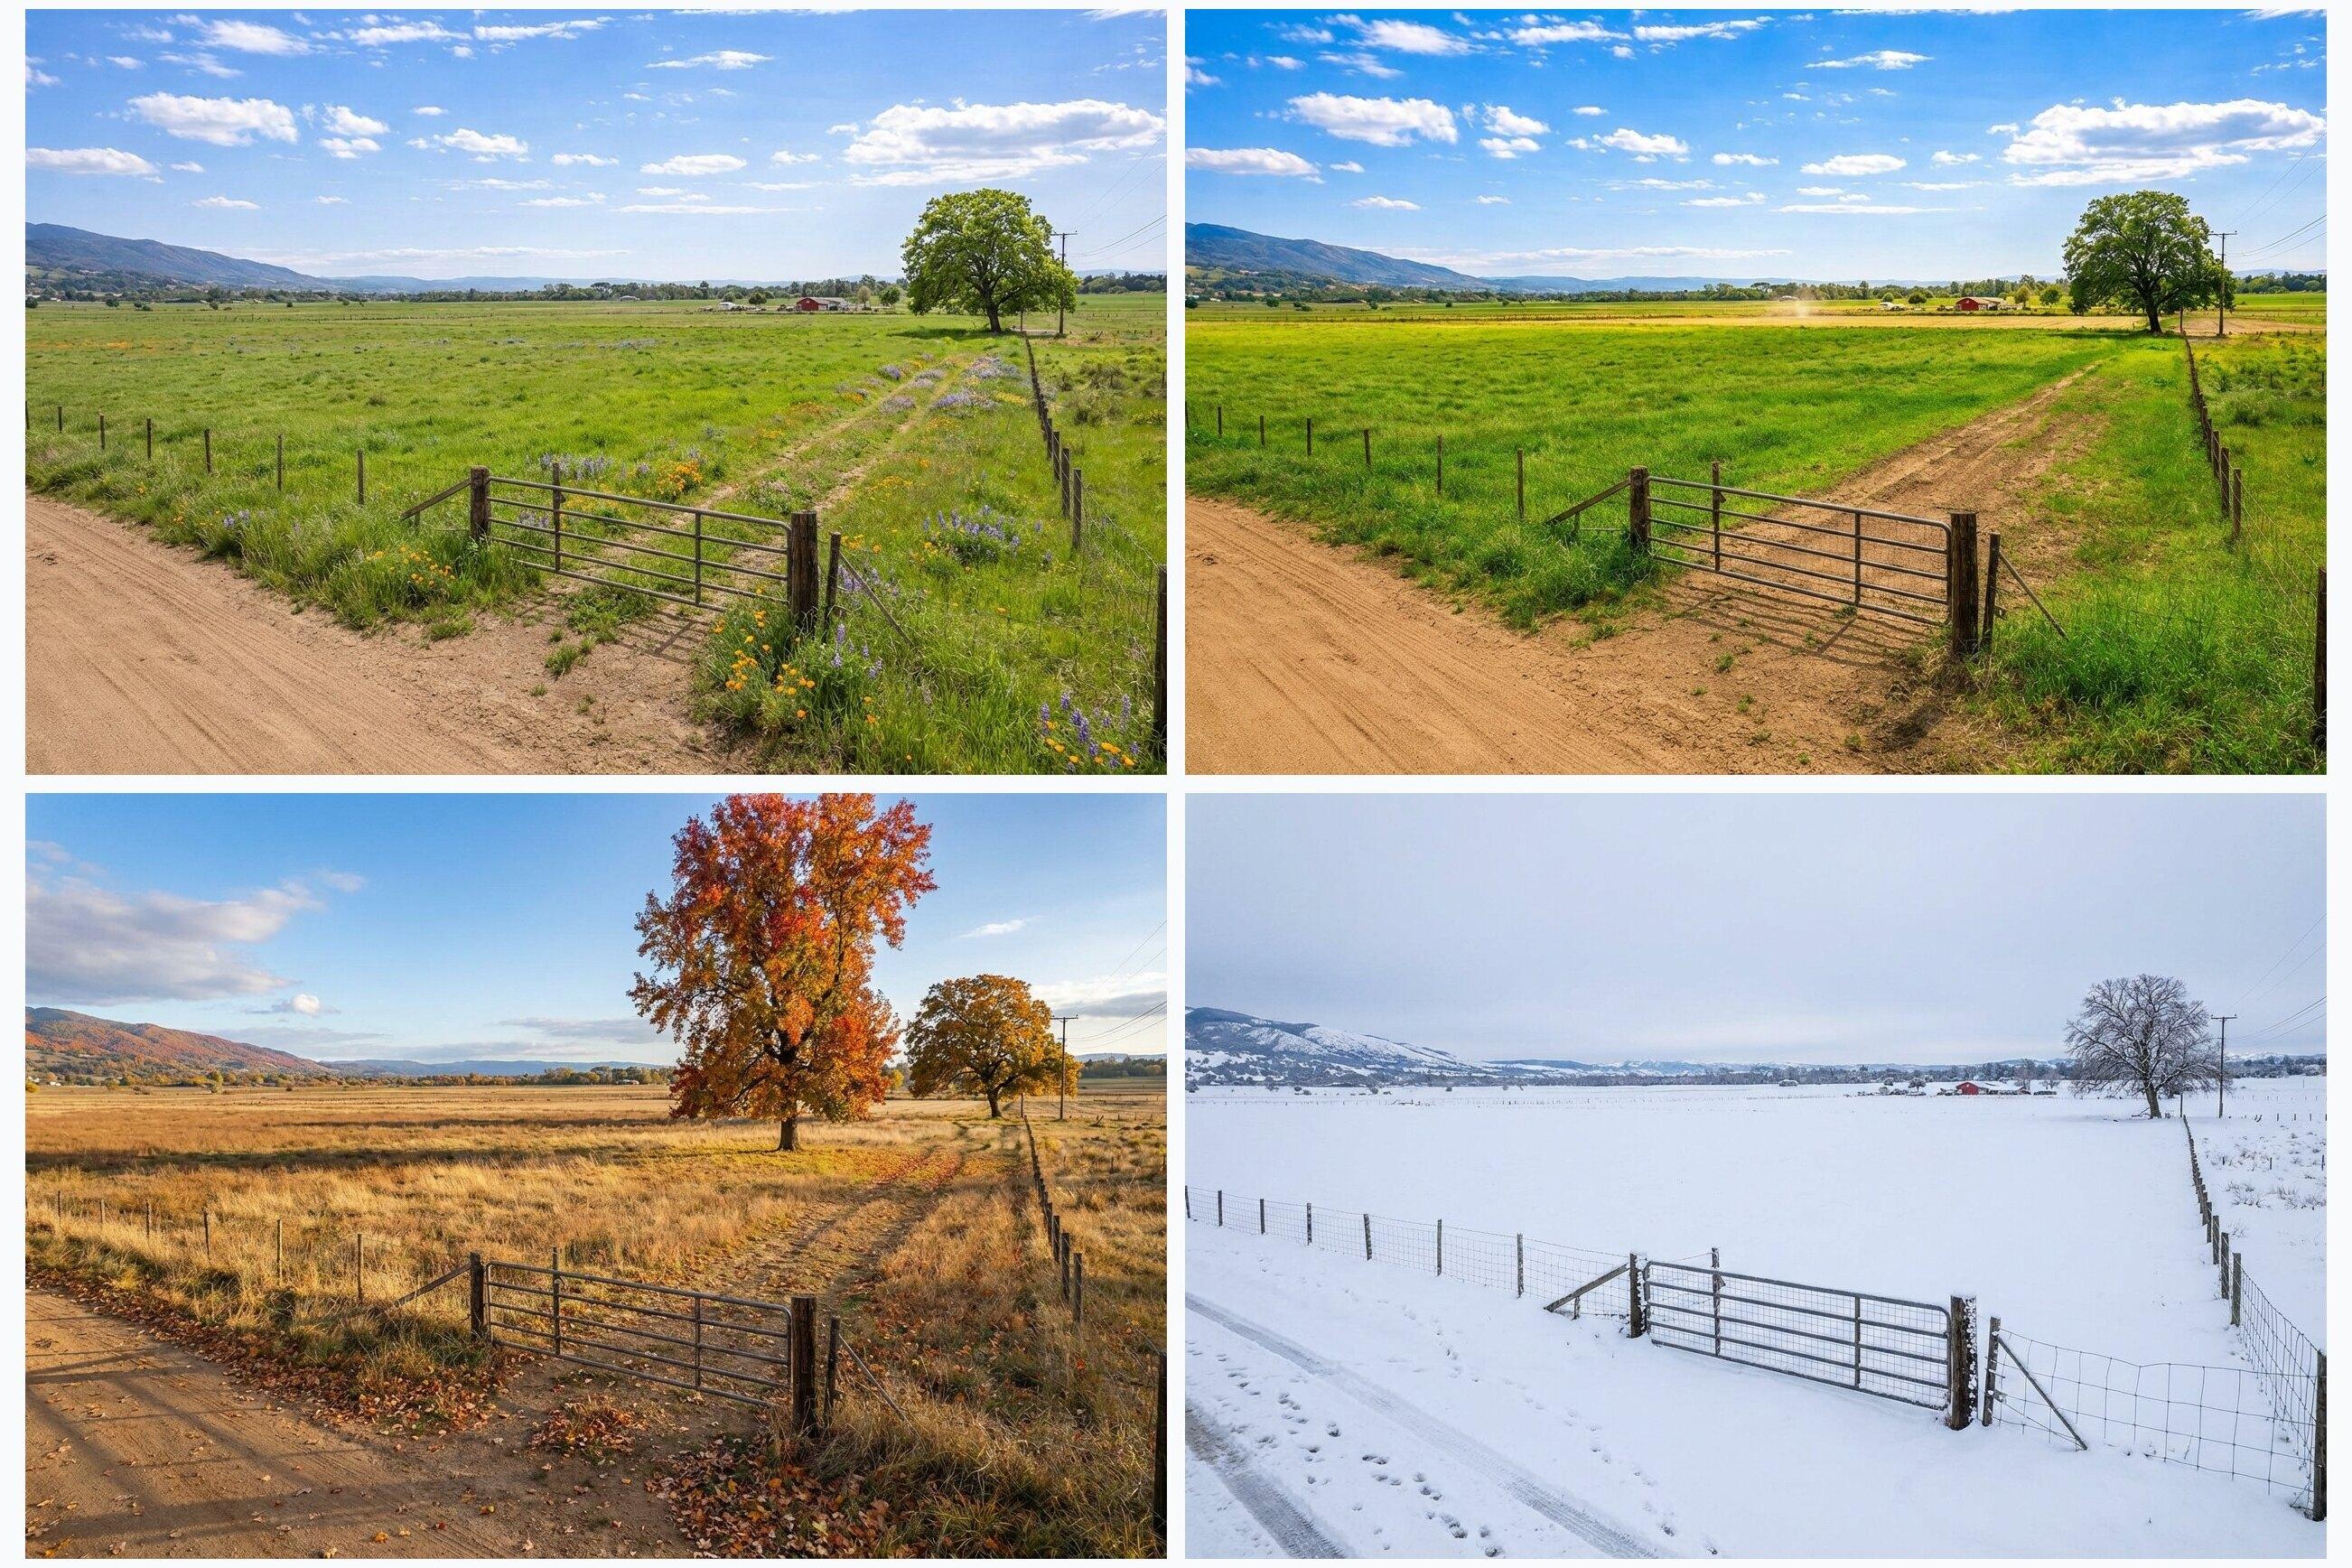
See land-only examples of raw listing photos turned into homesite, farmhouse, glamping, subdivision, seasonal, solar, and RV park concept visuals.


Accuracy depends on input quality. Recent sold comps, verified legal access, utility detail, terrain facts, and known constraints create a tighter range. This is not a certified appraisal.
Yes. Quick Estimate uses acreage, location, land type, access, utilities, buildability, market condition, and optional fallback anchors when comps are not ready.
The pro mode weighs comps by recency, distance, confidence, acreage normalization, and access, utility, and buildability similarity.
No. Use it for listing strategy and preliminary pricing. Appraisals, surveys, legal access, engineering, and permitting questions require qualified professionals.